Observability
The Argo Watcher server exposes Prometheus metrics on the same port as the API (default 8080) at the /metrics endpoint. Scrape it like any other Prometheus target:
scrape_configs:
  - job_name: argo-watcher
    static_configs:
      - targets: ["argo-watcher.example.com:8080"]
    metrics_path: /metrics
Exposed metrics
The server emits eight metrics today, all defined in internal/prometheus/metrics.go.
| Metric | Type | Labels | Description |
|---|---|---|---|
failed_deployment |
gauge | app |
Per-application failed deployment count since the last success. Reset to 0 when an application deploys successfully. |
processed_deployments |
counter | app |
Total deployments processed since server startup, per application. |
argocd_unavailable |
gauge | (none) | 1 when Argo Watcher cannot reach the Argo CD API, 0 otherwise. |
in_progress_tasks |
gauge | (none) | Number of tasks currently in progress (between submission and terminal state). |
argocd_refresh_duration_seconds |
histogram | app |
Duration of ArgoCD application refresh requests, to surface slow or stuck refreshes. Recorded only when the status check requests a refresh. |
gitops_writeback_duration_seconds |
histogram | app |
Time the git write-back held the per-repo lock, covering the clone/commit/push cycle plus any retries and backoff. |
gitops_lock_wait_duration_seconds |
histogram | app |
Time spent waiting to acquire the per-repository git write-back lock. High values mean tasks are queued behind concurrent write-backs to the same repo. |
deployment_duration_seconds |
histogram | app |
End-to-end wall-clock time of a successful deployment, from the start of rollout monitoring until the app reached the deployed state. Only successful deployments are observed (a failure's duration is dominated by the timeout). |
In addition, the standard Go runtime metrics from the Prometheus client library are exposed (go_*, process_*).
Suggested alerts
These alerts cover the failure modes the metrics are designed to catch. Tune the thresholds to your environment.
groups:
  - name: argo-watcher
    rules:
      - alert: ArgoWatcherCDUnreachable
        expr: argocd_unavailable == 1
        for: 5m
        labels:
          severity: critical
        annotations:
          summary: Argo Watcher cannot reach the Argo CD API
          description: |
            argo_watcher has reported argocd_unavailable=1 for more than 5 minutes.
            Tasks will not progress until connectivity is restored.

      - alert: ArgoWatcherFailingDeployments
        expr: failed_deployment > 3
        for: 10m
        labels:
          severity: warning
        annotations:
          summary: "{{ $labels.app }} has failed {{ $value }} times in a row"
          description: |
            The application has not deployed successfully for more than 10 minutes.
            Inspect the most recent task in the Web UI for the failure reason.

      - alert: ArgoWatcherTaskBacklog
        expr: in_progress_tasks > 50
        for: 15m
        labels:
          severity: warning
        annotations:
          summary: Task backlog growing on argo-watcher
          description: |
            More than 50 tasks have been in progress for over 15 minutes.
            Check Argo CD sync performance and DEPLOYMENT_TIMEOUT.

      - alert: ArgoWatcherSlowRefresh
        expr: histogram_quantile(0.95, sum by (app, le) (rate(argocd_refresh_duration_seconds_bucket[10m]))) > 30
        for: 15m
        labels:
          severity: warning
        annotations:
          summary: "{{ $labels.app }} ArgoCD refresh is slow"
          description: |
            The p95 ArgoCD refresh for this application exceeds 30s. A refresh that never
            settles (e.g. an app with a constantly-reconciling CronJob) can stall the
            deployment check — set the per-task refresh override (or ARGO_REFRESH_APP) to
            false for such apps.

      - alert: ArgoWatcherSlowGitWriteback
        expr: histogram_quantile(0.95, sum by (app, le) (rate(gitops_writeback_duration_seconds_bucket[10m]))) > 60
        for: 15m
        labels:
          severity: warning
        annotations:
          summary: "{{ $labels.app }} git write-back is slow"
          description: |
            The p95 git write-back for this application exceeds 60s, which points to push
            contention (retries/backoff) or, on a repo with an unusually large working tree,
            slow transfer of that tree (history depth is not a factor — clone and fetch are
            shallow). Check gitops_lock_wait_duration_seconds for the same app to see whether
            it is queued behind other write-backs to the same repository.
Example dashboard
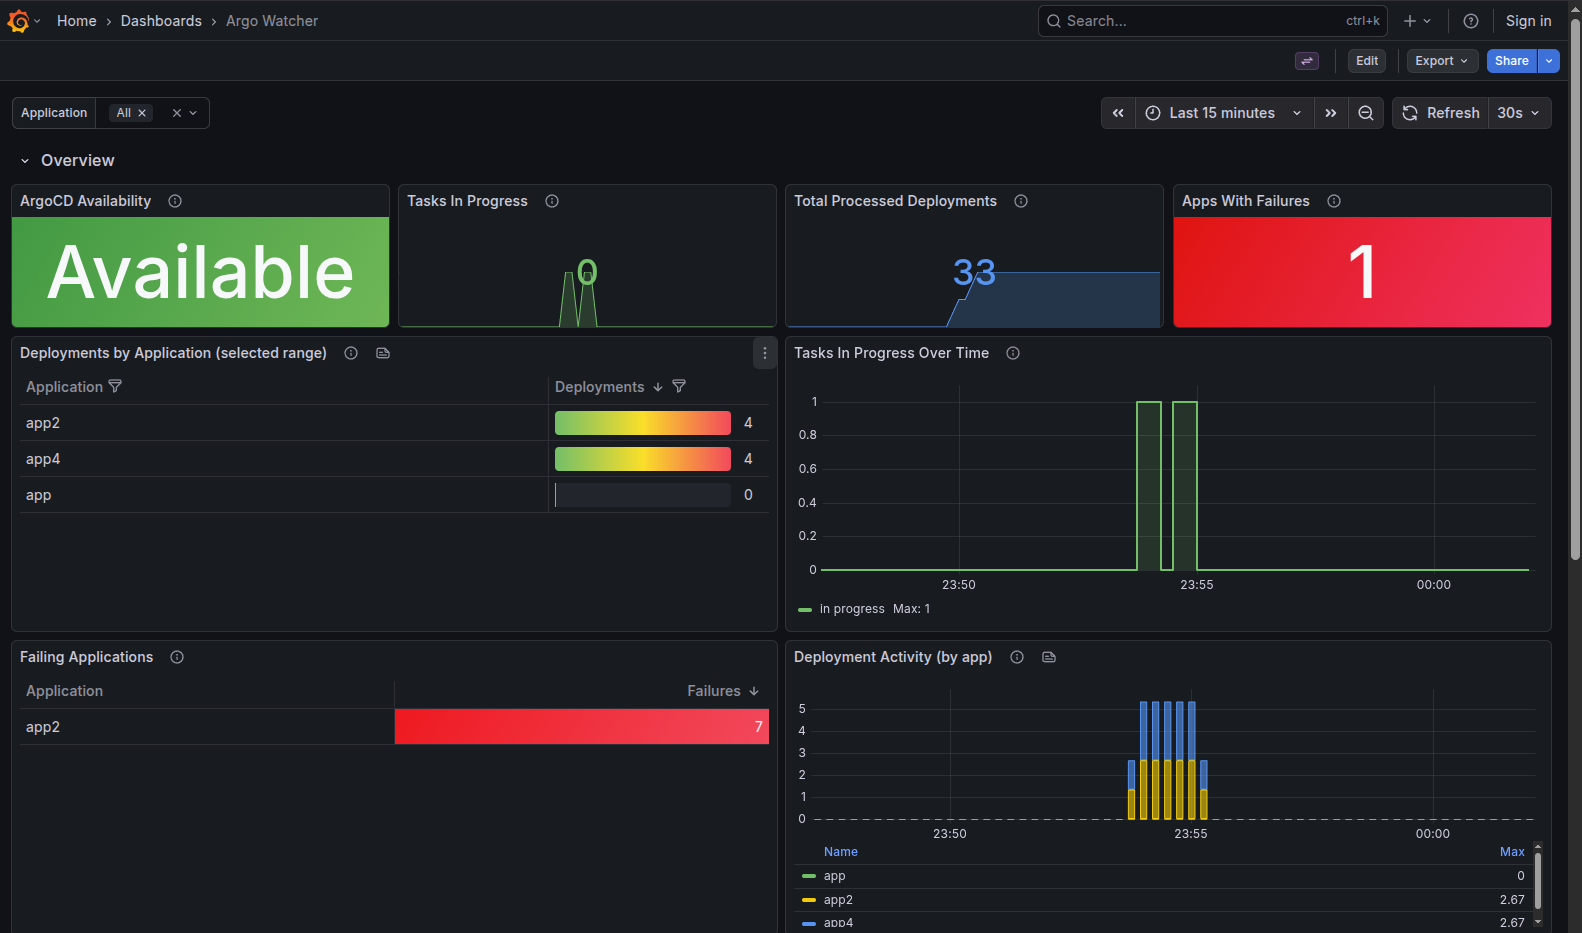
A ready-made Grafana dashboard lives in the repository at
monitoring/grafana/dashboards/argo-watcher.json.
It has an Overview row that illustrates every exposed metric in aggregate
(availability, in-progress tasks, deployment counts, failing apps) and a
Per-Application Breakdown row driven by an Application template variable, so
you can select one app (or several) and see its deployment counts, failures,
end-to-end deployment duration, and the refresh / write-back / lock-wait latency
percentiles.
Import it into any Grafana by uploading the JSON (Dashboards → New → Import), or spin up a self-contained Prometheus + Grafana stack next to the dev server:
This starts Prometheus (scraping the dev backend) and Grafana with the
datasource and dashboard already provisioned. Open Grafana at
http://localhost:3001 — anonymous admin access is enabled for local use, so no
login is required. Drive a few deployments through the client to populate the
panels.
The two Git Write-back Duration and Git Lock Wait Duration panels only
populate for applications using GitOps write-back (argo-watcher/managed); they
stay empty for status-only deployments.
Grafana panel queries
If you would rather build your own panels, these three cover the most useful operational views.
Active in-progress tasks
Use a stat or graph panel to monitor live workload. Pair with argocd_unavailable on the same dashboard.
Top 5 apps with consecutive failures
A bar gauge highlights which applications need attention. Drill into each app via the Argo Watcher Web UI to see the underlying task failures.
Deployments per hour, per app
A graph panel showing deployment frequency per application — useful for capacity planning and identifying applications that suddenly stop deploying.
Where to look next
- Troubleshooting — Operational runbook keyed off the same symptoms these metrics flag.
- Database — Backup, sizing, and migration guidance.